- Flash crash lows appeared to mark exhaustion point
- Hammer candle and strong momentum support case for reversal higher
- Break above trendline required for confirmation
The Australian-U.S. Dollar exchange rate is climbing steadily towards an important zone in the 1.72-3 region which, if pierced, could seriously undermine the bearish case and potentially break the ‘hold’ of the long-established downtrend.
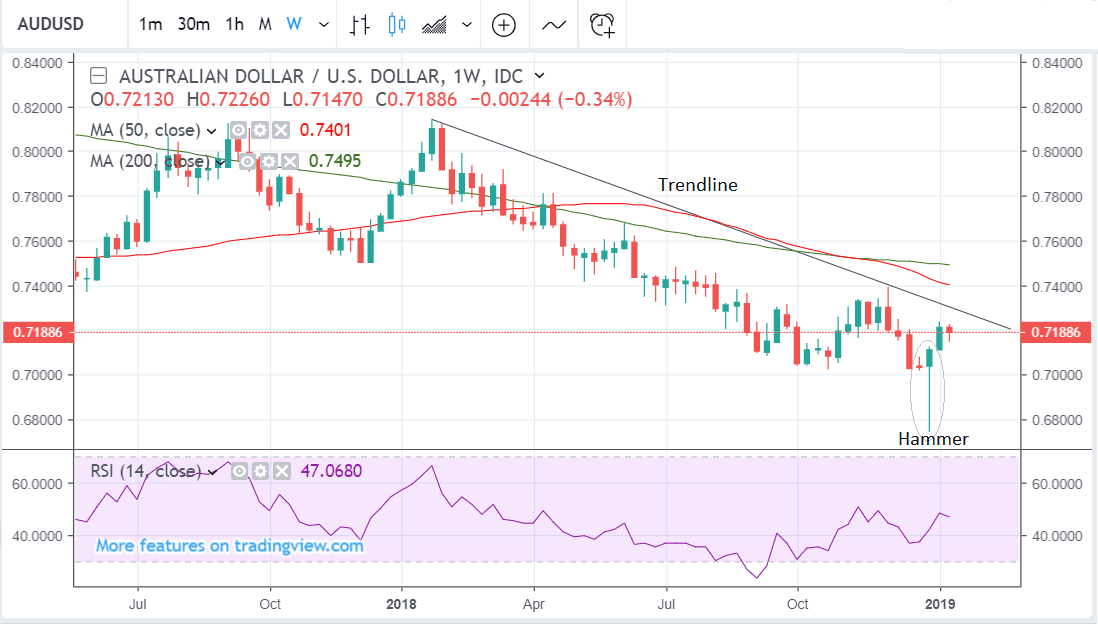
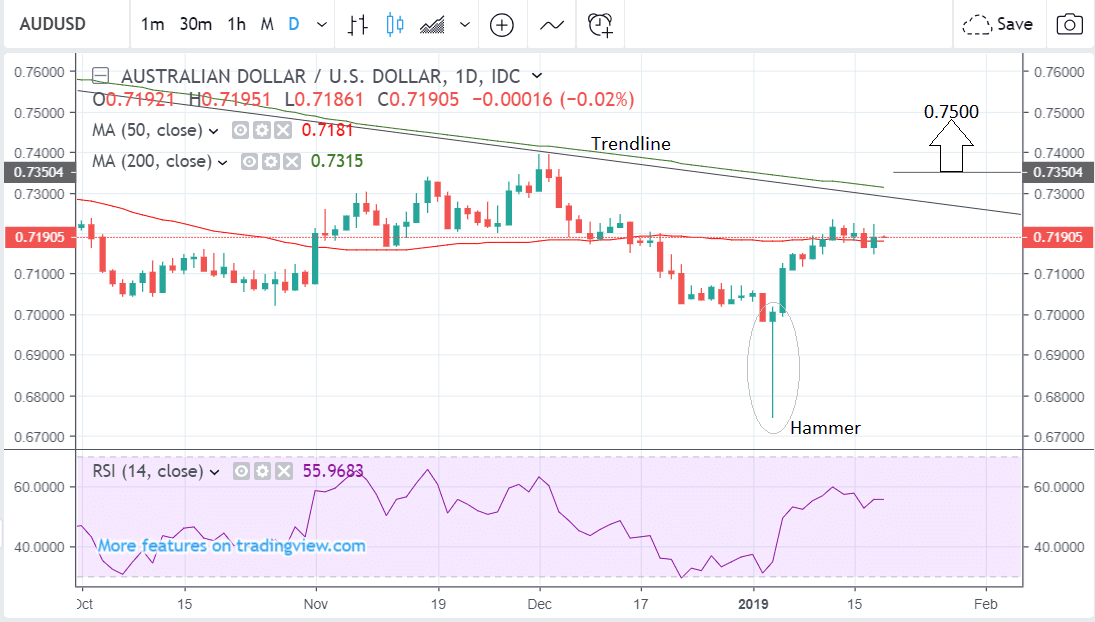
The pair has risen after forming a long bullish Japanese ‘hammer’ candlestick at the January 3 lows. This type of candle is generally accepted as a strong bullish reversal sign. It is enhanced by being succeeded by another bullish (green) candle immediately afterward, which is the case with AUD/USD (on both weekly and daily charts).
The strength of the hammer’s positive signal is further enhanced when the candle is longer-than-average, which is also the case on AUD/USD.
Especially long candles are indicative of ‘exhaustion’ when they form at the end of extended trends - the downtrend in AUD/USD has lasted for over a year. This end-of-trend placement is a further punctuation sign and a positive omen for the pair.
The RSI momentum indicator in the lower panel on both charts is constructive and suggests underlying confidence in the new uptrend. On both the daily and weekly charts momentum is at the same level as it was in November when the exchange rate was substantially higher, and this is indicative of potentially more upside to come.
Overall these signals all combined suggest a high chance the downtrend is reversing but are they definitive enough to confirm it to a high degree of probability?
The answer is probably not yet. There remain some major thresholds that bulls would need to overcome before they could claim control of the trend.
The most important of these is the trendline drawn from the January ‘18 highs which tracks the whole of the year-long downtrend. The exchange rate ought ideally to break clearly above this before bulls could legitimately claim dominance.
The trendline is the main ‘make-or-break’ deciding level for the pair from a trend perspective. If the pair closes above it on even just on a daily basis, it would be a strong sign the downtrend had finally been shattered.
Other levels that ought to be superseded are those of the major moving averages (MA) - the 50-day at 0.7180 and the 200-day at 0.7315. If these too were breached, the uptrend would also gain a major boost.
A break above 0.7350 would probably provide the confirmation required to support a breakout above this cluster of resistance, and open the way for a move higher to an initial upside target at 0.7500.
Those more able to stomach risk might consider simply waiting for a close above the trendline which is the more important of the cluster of resistance levels.