
Fed Ahead: Pound-to-Dollar Rate Expectations as Fed Expected to Disappoint Dollar-Bulls

The market is flagging up risks of the Fed delaying their next interest rate hike - a move which could further weaken the Dollar and in turn aid the uptrend in GBP/USD.
The US Federal Reserve deliver their results of a key policy meeting at 19:00 B.S.T on Wednesday, September 20.
The outcome should set the tone for an under-fire Dollar for the remainder of the month as further clarity is provided on whether or not another interest rate rise will be delivered in 2017.
It will also answer questions on the number of rate rises to come in 2018. Expectations that the Fed will ease on its rate hiking cycle have been a key reason for Dollar underperformance over recent months.
Robin Wilkins at Lloyds Bank sees a strong chance of the Fed dropping its plan to increase rates a third time in 2017.
Fed members expectations about the course of future interest rates are represented graphically using the Fed’s ‘dot plot’ which represents each of the 16 member’s view with a dot placed at the corresponding level of where they expect interest rates to be at a set time in the future:
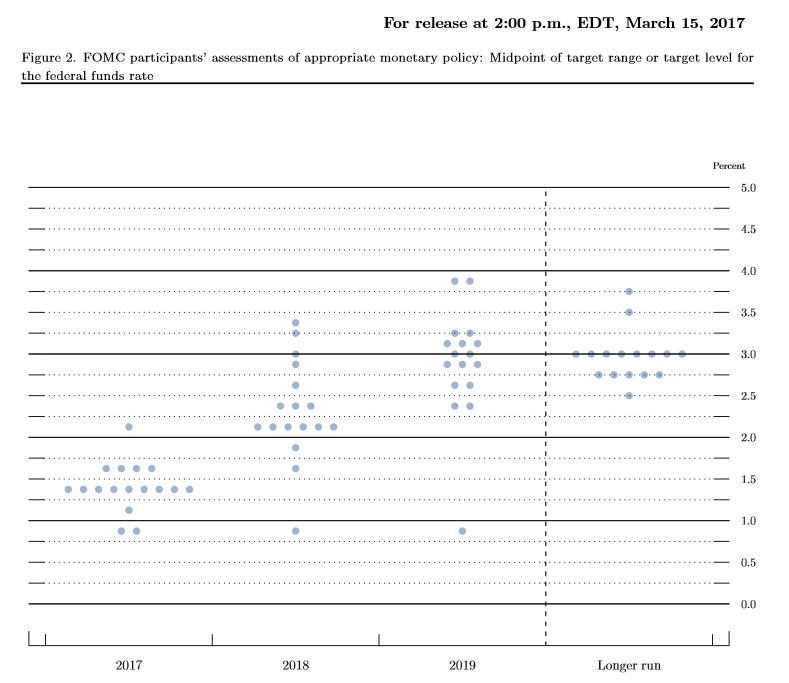
Lloyds’s Wilkins expects the dots to move lower for the end of 2017, reflecting a change of heat by Fed member’s about the need for higher rates.
“All eyes will be on the ‘dot-plot’ and as we think there is a risk a majority of members will signal no further rate rise this year – but keep three hikes in for 2018 and 2019. This would disappoint the rates markets and the USD in the short-term,” says Wilkins.
Lacklustre inflation has been blamed for raising the possibility of the Fed delaying but a recent report by ING also noted other factors, including a subdued growth outlook post-hurricane Harvey, geopolitical concerns around North Korea and Trump policy inertia.
Indeed, inflation has risen in August from 1.7% to 1.9% and a three-month high, although the Fed’s preferred gauge, Personal Consumption Expenditure (PCE) was only at 1.4% in July.
Get up to 5% more foreign exchange by using a specialist provider by getting closer to the real market rate and avoid the gaping spreads charged by your bank for international payments. Learn more here.
Mixed Technical Views
If we had expected technical analysts to provide us with any hints as to what the Fed might do later today we would be disappointed as the field of views represents a broad spectrum, from CMC markets outright bearish position to Hantec Markets' Richard Perry’s cautiously bullish view.
However, we personally favour Commerzbank’s technical analysis and Hantec Markets' as offering the most balanced advice.
Commerzbank note the pair has risen to a strong level of resistance where an old trendline (from 2014-17) is presenting a barrier to further gains – we concur as we too have noted that old trendline too in our recent studies.

Furthermore there is resistance from a ‘Fibo level’ which is a Fibonacci ratio retracement of the previous downmove.
These Fibo levels – the main ones of which are set at 38.2%, 50% and 61.8% of the previous move - are thought to carry a special significance on price charts, acting as levels of support and resistance to price moves.
However, Commerzbank’s Karen Jones also notes how the Elliot wave count favours more upside and this is a bullish sign.
“Given the convergence of resistance here we would expect this to hold the initial test and provoke some profit taking. However currently the intraday Elliott wave counts are positive. In order to alleviate immediate upside pressure the market will need to fall sub 1.3267 (August high),” says Jones.
Elliot waves are components of a type of cycle analysis, and these suggest we are in the midst of a larger upmove with more price gains to be had on the horizon.
Perry of Hantec Markets is cautiously bullish, reflecting that the trend is still ‘up’ and given the old trader’s maxim “the trend is your friend until the bend at the end,” more likely to continue than reverse.
“Technically, Cable remains strong with positively configured momentum indicators, even though they may have begun to plateau,” he notes.
GBP/USD is pulling back to old support in what appears to be a ‘throwback move’ on his chart, which is a move which occurs immediately after a breakout but is almost always followed by a continuation higher again, and assuming a bullish continuation Perry sees “little real resistance” until the 1.38s.

Our own view is that the pair is in a storng uptrend which is showing no signs of reversing and is likely to continue rising.
However we agree with Karen Jones that the 2014-17 trendline is a formidable obstacle higher.
We therefore see two possibilities – either that the pair goes sideways and the Fed adopts a line which is roughly neutral in relation to market expectations and therefore leads to little volatility, or that the pair will break higher on Pound strength if the Fed take a more cautious line and downgrade their expectations for the trajectory of future interest rates.
If such a move were to develop we calculate it would probably reach 1.3800 based on the height of the move prior to the trendline break (a).

The MACD momentum indicator is peaking and looks vulnerable to a pull-back as it moves further away from its signal line.
The R2 monthly pivot is a formidable support line widely watched by traders which is likely to provide an obstacle to deeper declines at the 1.3490 level.
Get up to 5% more foreign exchange by using a specialist provider by getting closer to the real market rate and avoid the gaping spreads charged by your bank for international payments. Learn more here.


