Weekly Reversal on AUD/USD and NZD/USD Favours More Downside
The AUD/USD and NZD/USD charts are showing a clear technical bias for more downside, according to analysts at NAB Bank.
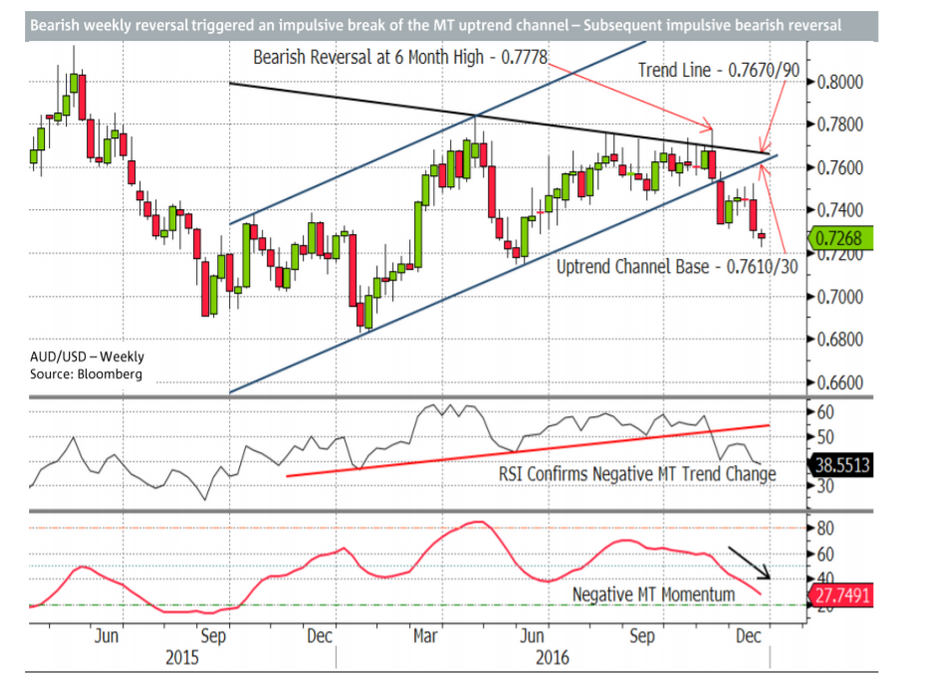
Bearish weekly signals were provided by a breakdown below a key trendline on AUD/USD and the “Battle between the multi-year downtrend and the one-year uptrend being won decisively by the LT downtrend,” said NAB.
A negative close below 0.7600 and week momentum signals provided a “host of evidence,” confirming the negative multi-week outlook.
NAB now see the pair falling to a target at 0.7150/0.7200.
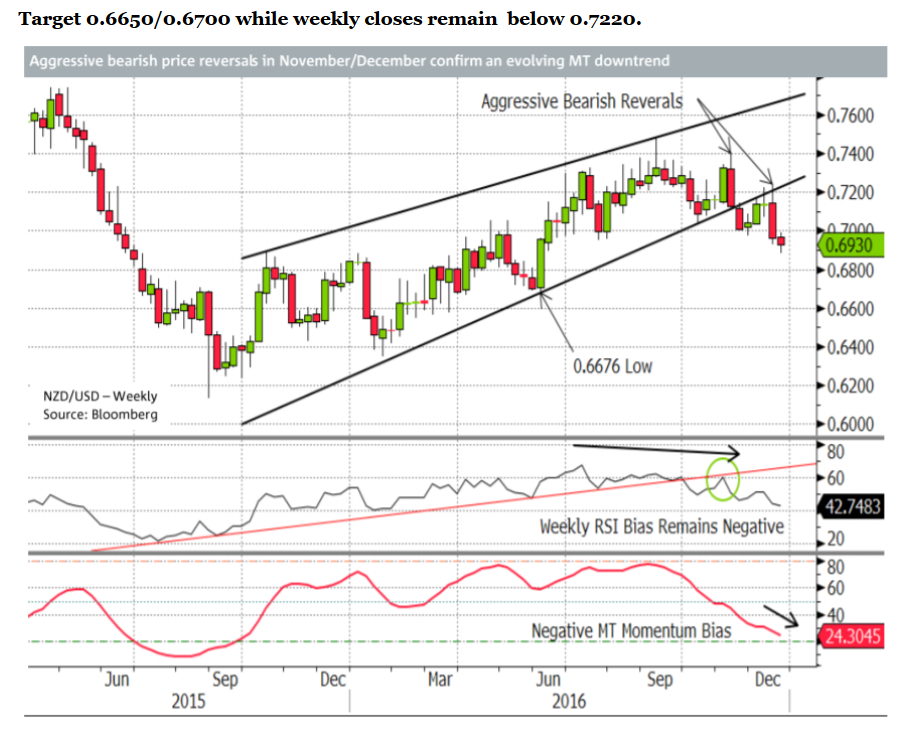
The outlook for NZD/USD is similar after the pair broke down and out of a rising channel.
“The bearish reversal patterns produced in November and December are confirmed by a most bearish MT momentum bias and highlight a negative outlook that has been further enhanced by a series of weekly closes below the broken trend channel base (currently 0.7200/20),” said NAB.
NAB see the pair falling to a target at 0.6650/0.6700 as long as the pair remains below 0.7200.
The chart below shows the strong bearish reversal weeks in November ND December as well as the bearish break out of the channel.
When prices break out of channels they normally move the same distance as the height of the channel at its widest point.
For NZD/USD this indicates a fall of roughly 6 cents from the breakdown point at 0.7100 which chimes with NAB’s 0.6650 target – perhaps suggesting the possibility of an even deeper contraction.