
© Adobe Stock
- GBP/JPY has pulled back to critical 142.00 level.
- But flag pattern suggests uptrend to remain intact.
- A breakout higher could result in move up to 148-150.
The Pound-to-Yen rate remains biased toward the upside, Pound Sterling Live technical studies suggest, even in the face of an ongoing rally from undervalued lows by the Japanese currency.
Signs that global equities are about to take another hit and uncertainty over the outcome of the U.S.-China trade talks have lifted the Japanese unit of late, making it the second best performing G10 currency against the Pound.
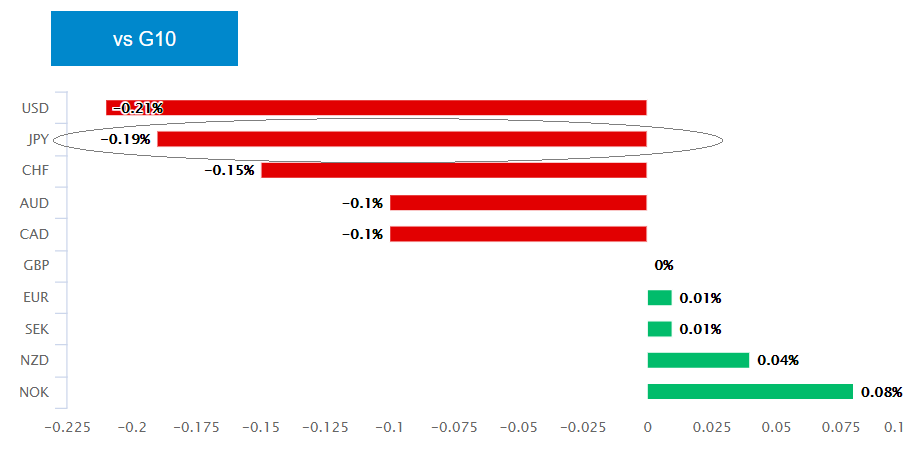
Above: Pound Sterling's performance relative to G10 rivals.
As a consequence of the Yen’s rise, the GBP/JPY rate fell -0.25% Thursday and the question some traders are asking themselves now is whether this is a temporary bout of weakness or if a much steeper decline is now in the cards.
The exchange rate is still in a short-term uptrend, so a continuation of recent weakness would constitute a major technical U-turn for the pair.
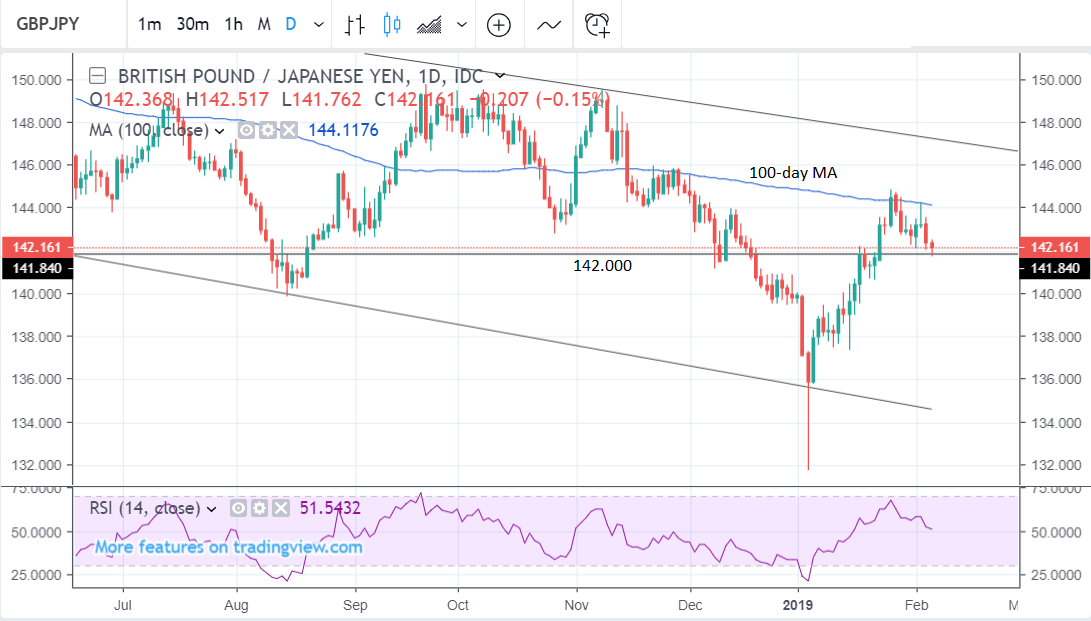
Above: GBP/JPY rate shown at daily intervals.
The 142 level at the current flag pattern low is a key area that will need to hold if further losses are to be avoided.
Yet, and although a steeper decline is still possible, there are also reasons to believe a continued descent is not the most probable outcome.
“As price starts slipping below 142.00, the next key support level is seen around 141.25-50 before the 141.00 handle comes into play,” says Justin Lowe, an analyst at liveforex.com.
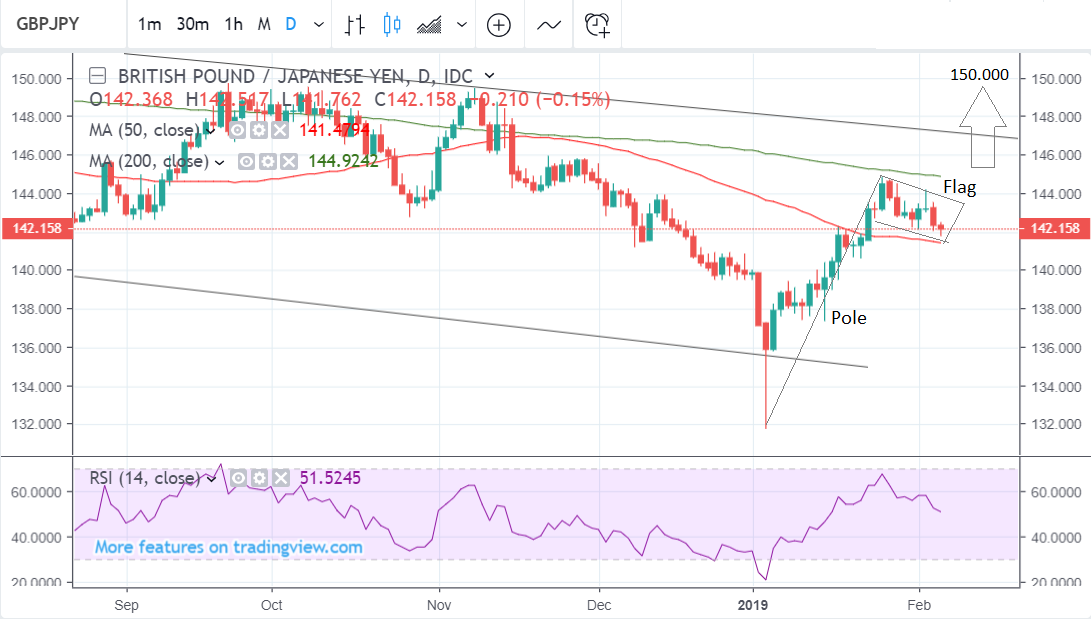
Above: GBP/JPY rate shown at daily intervals. Includes flag pattern.
The formation of a flag pattern that can be seen on the above and below charts is a bullish signal that suggests the market remains biased toward the upside, although this is a short-to-medium term signal.
The length of the pole is an indicator of how far the flag could rise if it breaks out of the top of the flag square.
It suggests a move all the way up to the 150.0 area is possible, although the trendline at 147.0 is a more viable target for the short term.
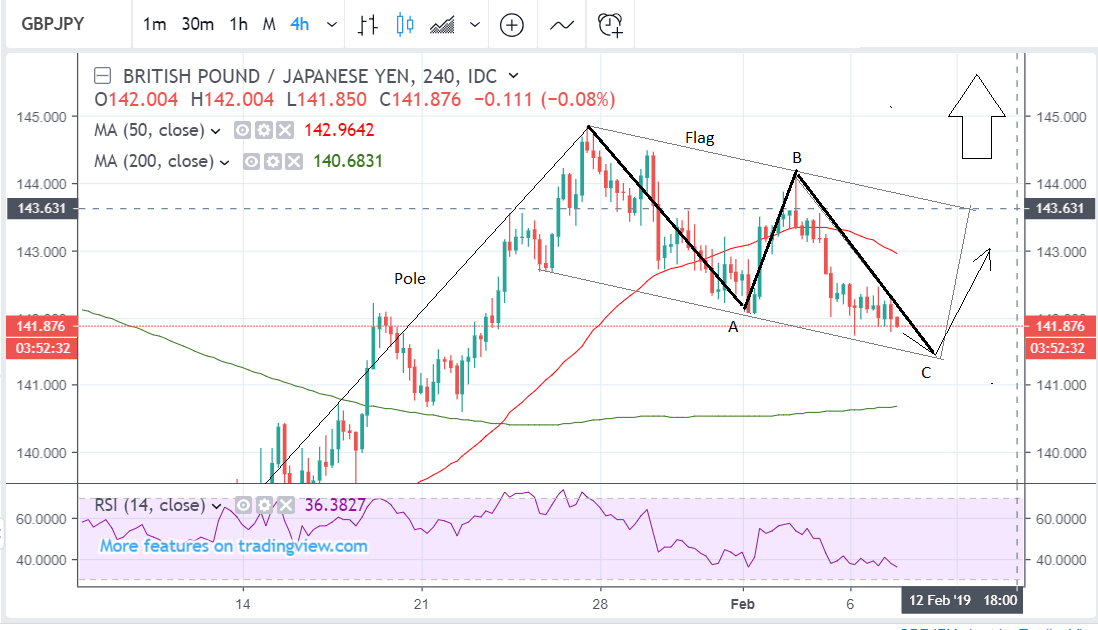
Above: GBP/JPY rate flag pattern. Includes flag pattern.
The 4hr chart above shows the component waves of the bull flag in more detail and explains why the pair is just as likely to rise as it is to fall.
The move down from the late January highs can be described as a three-wave corrective pattern, or ABC move, which often give way to a resumption of the dominant trend.
These patterns are composed of three-wave, labelled A, B and C, which appear on charts in a sort-off zig-zag formation. Usually waves A and C are of a similar or equal length, which means C is probably almost finished in the case of GBP/JPY. If C is not already complete, it could finish in the mid-141 area.
The Yen is tipped as a currency that will rise this year because it is so undervalued. Yet the same can be said of the Pound, which has been depressed because of fears the UK is headed for a hard Brexit.
A majority of analysts say the UK will avoid a hard Brexit, while some say it might even abandon the attempt to leave the EU, which suggests much more upside potential for the Pound over the coming months. That fundamental outlook dovetails more easily with the technical bull-flag pattern on the charts.
 Time to move your money? Get 3-5% more currency than your bank would offer by using the services of foreign exchange specialists at RationalFX. A specialist broker can deliver you an exchange rate closer to the real market rate, thereby saving you substantial quantities of currency. Find out more here.
* Advertisement