The Pound-to-Dollar exchange rate has been rising since making a low at the start of October, we analyse the views surrounding this move and the current market structure in an effort to determine whether it is likely to extend or not.
One of the challenges of technical analysis is to determine whether the price is in a trending phase of a corrective phase.
If it is trending you want to get on the back of it and ride it - if corrective you want to wait until the correction ends and then get on the back of the trend and ride it.
The dilemma of 'is it in a trend or a correction' is highlighted by the current market price action on the Pound-to-Dollar daily chart.
The pair bottomed at the October 6 low, reversed and has been moving up ever since.
It has now recovered about 50% of the previous down-move, which is a substantial amount.
Could this be the start of a new uptrend, or is the pair likely to crumble and start going lower again?
Commerzbank's Karen Jones, seems to be of the view that the October rally is merely corrective, and downside should resume.
"GBP/USD’s correction extended higher last week, and has reached the 50% retracement at 1.3343," she says.
The 50.0% Fibonacci level is a key market level representing the midpoint of the previous wave and is often a point at which the market stalls, consolidates or rotates.
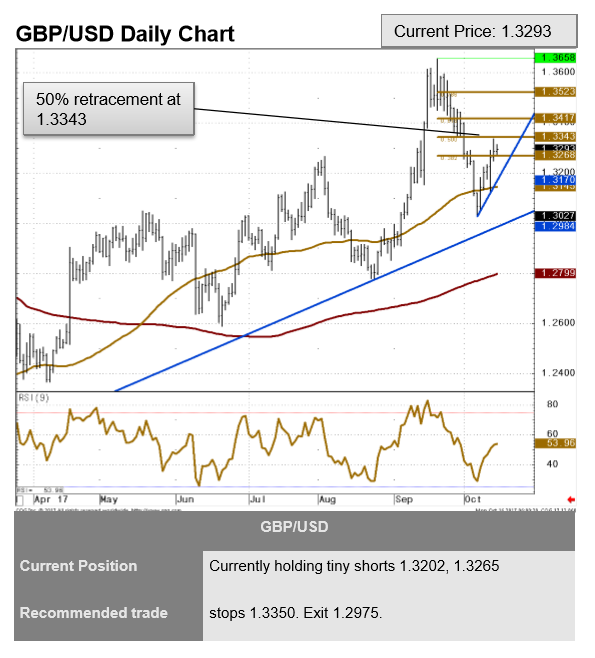
Jones thinks the exchange rate will fail at the 50% completely, leading to a reversal and a move back down to the 1.2830.
She then sees the potential for further downside from there to the 1.25s.
"The market has recently failed at the 1.3557 2014-2017 downtrend and is viewed negatively," she concludes.
Our own analysis suggests the possibility that the October rebound could actually be a young recovery move which might continue growing.
The pair has broken above a trendline, for example, labelled 'A', which is a key breakthrough, and it has followed through to the upside.
After a trendline break a pair normally moves roughly the same distance, labelled 'a' as the move prior to the break, labelled 'b' (see chart below), and GBP/USD has now reached this target at 1.3317.
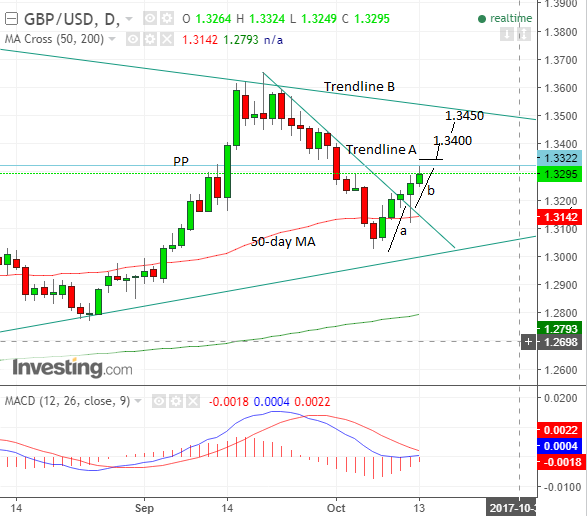
It has also met resistance from both the 50% retracement mentioned by Karen Jones and the monthly pivot (PP) at 1.3321 - a level traders often use to counter trade versus the dominant trend. The pivot is calculated using the open, high, close and low of the previous month.
The pivot is a level of strong support and resistance in itself, which is why the exchange rate has pulled back after encountering it - pulling back down to just below 1.3250.
Despite the target from the trendline break having been met, and the various resistance levels directly above the exchange rate there is no strong evidence yet of a reversal back down so we remain inclined to be bullish.
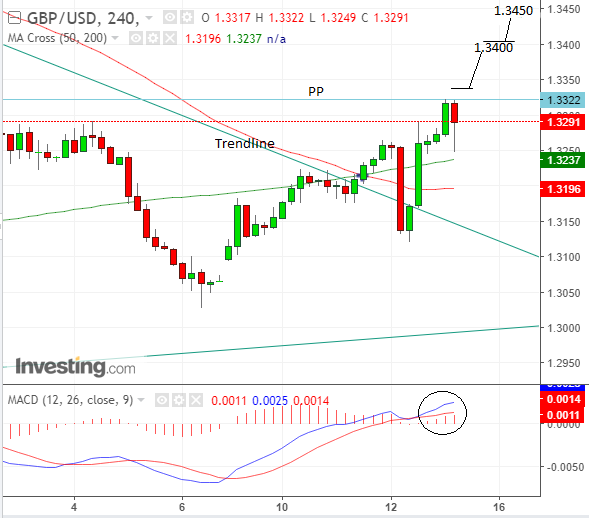
The sequence of peaks and troughs on the four hour chart remains up-trending and this, and the trendline break are still important bullish signs.
I continuation of the short-term trend would gain confirmation from a break above 1.3345, with an upside target thereafter at 1.3400.
There might very well then follow a continuation up to a target at 1.3450, as there are no major resistance levels until you get to the trendline ('B') at around 1.3475/1.3500.
Get up to 5% more foreign exchange by using a specialist provider by getting closer to the real market rate and avoid the gaping spreads charged by your bank for international payments. Learn more here.