
GBP/USD is at a key battleground level which will determine which way the market eventually plays out.
The Pound-to-Dollar exchange rate has reached a cross-roads and those wishing to buy Dollars might be best placed to hang on before trading in their Pounds, as there is a distinct possibility the exchange rate could make substantial gains.
The Pound's bounce from the 1.30 lows on Monday to levels noted around 1.32 mid-week brings the market back to a make-or-break chart level which is likely to see the pair either breakout higher and move up to the 1.3300 level, or fold and resume its strong, short-term downtrend.
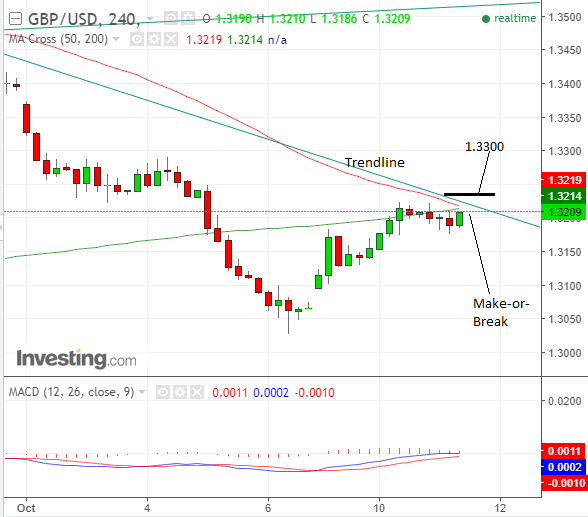
Our experience of charts such as this favours a break higher as opposed to a resumption lower but some key resistance points must be overcome first, that said at the time of publicationg the exchange rate has fallen back to 1.3177 which could be a sign that resistance is holding.
The significant make-or-break level is a trendline just above the current market level, as well as the 50 and 200-four-hour MAs close by.
This cluster of levels will act as an obstacle to further gains and we would want to see confirmation from a break above the trendline, signaled by a move above 1.3235, before forecasting more upside.
Such a breakout would then have a high chance of rising to 1.3300, our next upside target for the pair.
Get up to 5% more foreign exchange by using a specialist provider by getting closer to the real market rate and avoid the gaping spreads charged by your bank for international payments. Learn more here.
Longer-Term Chart Bearish
Whilst the short-term charts hold out the hope for a surge higher, panning out to longer-term timeframes we see vulnerabilities.
The weekly chart shows how the pair was moving higher in a channel for most of the year until it overshot in late September, peaked, and then fell back down.
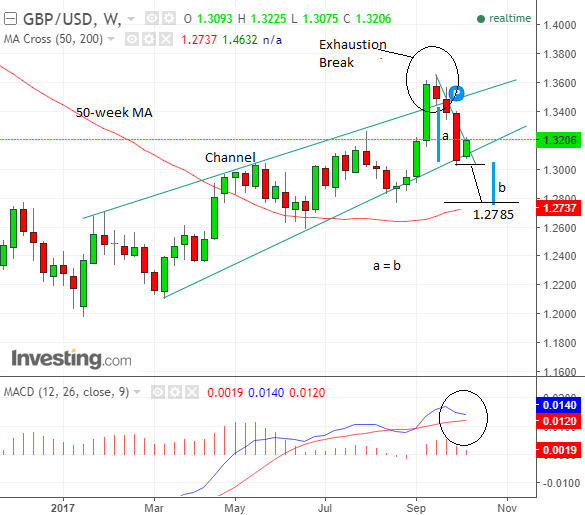
This sort of move is known in technical analysis as an exhaustion break and it is a strong indicator that the trend has finished and the pair will begin a new trend down.
As such the overshoot and subsequent capitulation gives the chart a bearish bias, however, the pair has bounced after selling off down to the lower trend-line for the move at 1.3100.
To restate the bearish case and expect lower rates we would ideally wish to see a clear break below the lower border line of the channel, confirmed by a move below the 1.3027 lows taking the pair down to a medium-term target at 1.2785.
This target is based on the height of the channel (a) extrapolated lower (b) as this is the normal technical method to forecast the move following a channel breakout.
This actually establishes a target even lower down at 1.2700, but we have adjusted it higher because of the location of the 200-day moving average (MA) at just below 1.2785, and large moving averages often provide turning points for the market.
The MACD momentum indicator is the only fly in the ointment for the bearish case as it is not as bearish as price action suggesting a lack of oomph in the downtrend, as a possible bullish undertow.