"The bearish trend remains firmly entrenched and attention remains on the 1.0923 12th October low and the 1.0356 all-time low charted in September," Karen Jones, Society of Technical Analysts

Image © Adobe Images
So, in a week in which dizzy Lizzy resigns and the UK faces its second Tory leadership contest, I find myself starting to yearn for a return by Boris Johnson – I freely admit that I cannot stand him, but surely anybody would be better than nobody?
We may have seen a minor rally by the FTSE and pound on her resignation, but this looks to be short lived, let’s take a look what the charts have to say….
With GBP/USD still capped by its 55-day ma at 1.1488, the bearish trend remains firmly entrenched and attention remains on the 1.0923 12th October low and the 1.0356 all-time low charted in September.
So the prospect of a new leader has been met with a good dash of sangfroid – it certainly has not done enough to reverse the recent slide of the poor Pound.
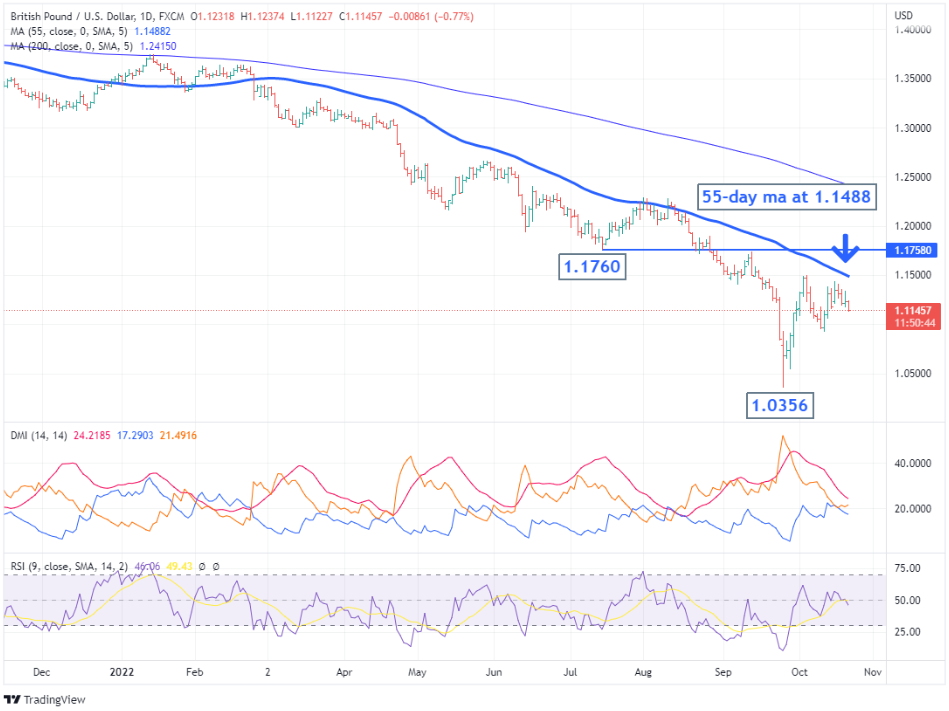 Above: GBP/USD at daily intervals with Society of Technical Analysts annotations and indicators. Click image for closer inspection.
Sterling’s weakness cannot be attributed to the mess in Westminster alone, it is of course the mighty US Dollar, which has been the main contributing factor.
While one might think that the US Dollar has not done much over the past 6 weeks but hold sideways, it has in fact been going sideways in a contracting range.
This range is easily identifiable as a potential symmetrical triangle…why is this important? Because it looks mature, and the US Dollar Index looks ready to break out of the range bordered by 113.40 and 111.60.
While you have to wait for the range break to confirm direction, it is worth pointing out that symmetrical triangles are more likely to be continuation patterns than reversal ones. Above 113.40 lies the 114.75 September peak.
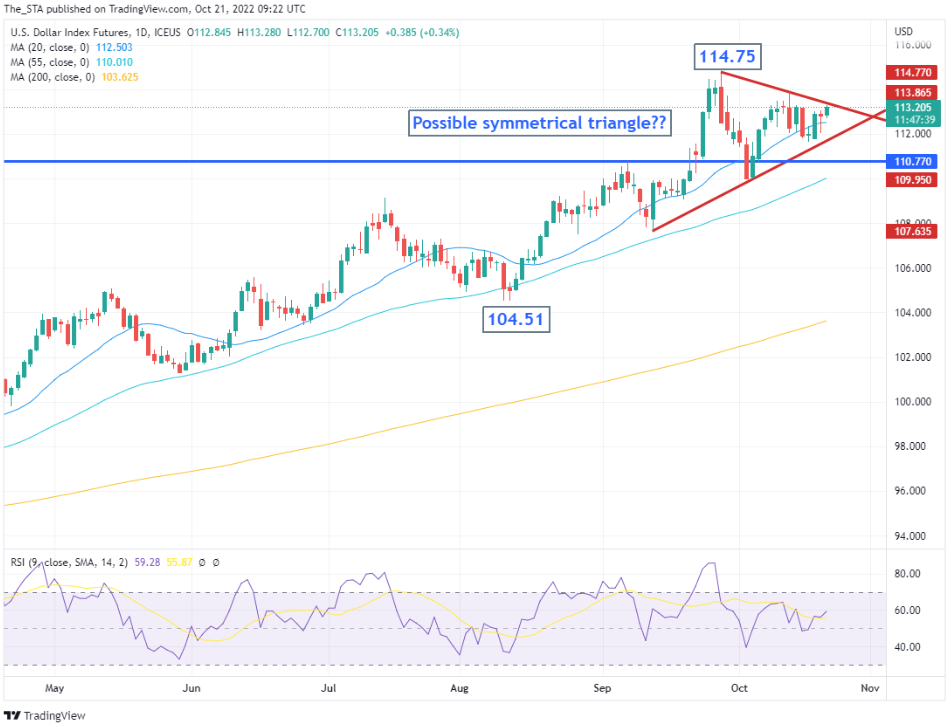 Above: U.S. Dollar Index with Society of Technical Analysts annotations and indicators. Click for closer inspection.
As for EUR/USD, where are we here?
Well still in the same old boat – it remains under pressure and fairly subdues below its 2022 downtrend, which offers resistance at 0.9959.
Again we can spot a potential symmetrical triangle and this one will break down should .9675 give way. This would leave the recent low at .9536 back under the spotlight.
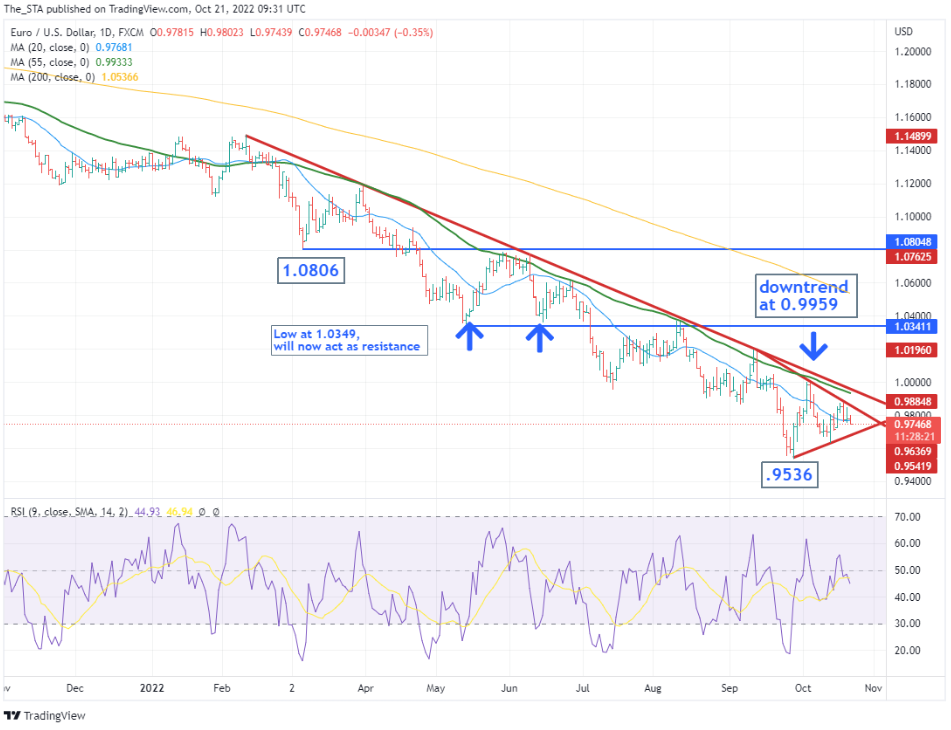 Above: EUR/USD at daily intervals with Society of Technical Analysts annotations and indicators. Click image for closer inspection.
The information posted on Pound Sterling Live is for informative purposes and is not intended to constitute advice in any form, including but not limited to investment, accounting, tax, legal or regulatory advice. The information therefore has no regard to the specific investment objectives, financial situation or particular needs of any specific recipient. Opinions expressed are our current opinions as of the date appearing on Pound Sterling Live only. All illustrations, forecasts or hypothetical data are for illustrative purposes only. The Society of Technical Analysts Ltd does not make representation that the information provided is appropriate for use in all jurisdictions or by all Investors or other potential Investors. Parties are therefore responsible for compliance with applicable local laws and regulations. The Society of Technical Analysts will not be held liable for any loss or damage resulting directly or indirectly from the use of any information on this site.