
USD/CAD: The Possible Upside Targets, Barclays Forecast Oil Price Recovery in Q4
The USD/CAD exchange rate has broken out of a triangle pattern and is rising, what are the possible targets to the upside?

The Canadian Dollar (CAD) has been impacted by the continued decline in oil prices and a tentative tone evident across global financial markets.
The spread between US and Canadian bond yields is widening in a CAD-negative manner as the US Fed looks to raise interest rates once more, pushing up US yields in the process/
"Broader risks are likely to remain dominant throughout the week as we note the lack of domestic data releases ahead of Friday’s monthly GDP for May. We maintain a bearish CAD bias," says Eric Theoret at Scotiabank.
Where next for the pair? The US Dollar is rising against the Canadian Dollar after breaking out of a triangle, clearly visible on the daily chart (see below).
It has risen due to a combination of falling oil prices which are highly correlated to the pair and expectations that the Federal Reserve may strike a more upbeat tone at their rate meeting on Wednesday, ushering in another period of possible rate hikes.
The big question is how much higher can the pair go after the breakout?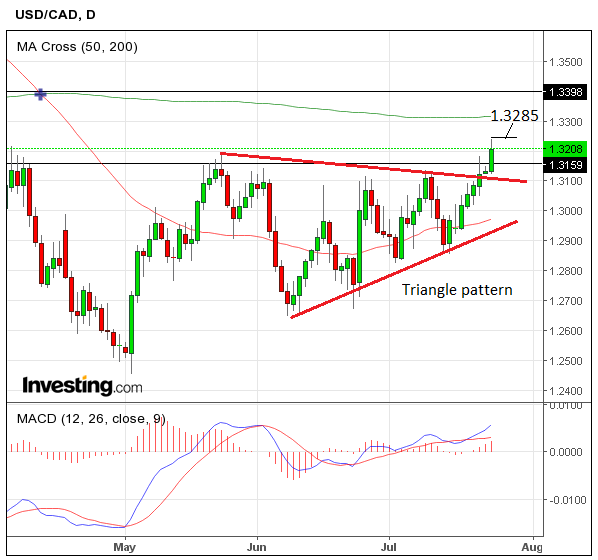
Normally the answer lies in the height of the pattern itself, since the classic way of forecasting the length of a breakout is to extrapolate the height of the pattern - which in this case is a triangle - higher.
To be extra conservative some technical analysts extrapolate 61.8% of the height of the pattern (at its widest) from the point of the break.
In this case, if you do all the maths, it gives an eventual target for the move at roughly 1.3440.
The target falls at the upper end of a zone highlighted by Scotiabank’s Shaun Osborne as a target range for the pair:
“USDCAD has made a decisive break of its May 24 1.3188 high, clearing 1.32 to reach levels last seen in late March. We maintain a bullish USDCAD bias with expectations of a rise toward 1.33 and 1.35, and note that momentum indicators remain remarkably muted with an RSI of 64 leaving ample space for further upside ahead of the overbought threshold at 70," says Theoret.
The Scotiabank strategist goes on to forecast a dynamic move, which could possibly go even higher:
“Typically, after a period of subdued range-trading, the kind of “coiling” or range compression we have seen in USDCAD recently leads to a more dynamic phase of market movement. The risks of a topside overshoot relative to our target later in the year should not be ignored.”
The currency team at DailyFX see a possibility the pair will stall at tough resistance in the 1.33s:
“There is a confluence of resistance USD/CAD will need to push through to tack on any meaningful gains. There are 4 levels of resistance joining in an 80 pip range that is likely to slow down or possibly resist prices.”
This “confluence” includes the 200-day moving average, the, “38.2% retracement of the Jan 20 to May 3 2016 down trend (1.3315)”, and various Elliot Wave targets also in the 1.33s. Of these the most significant is the 200-day moving average at 1.3304.
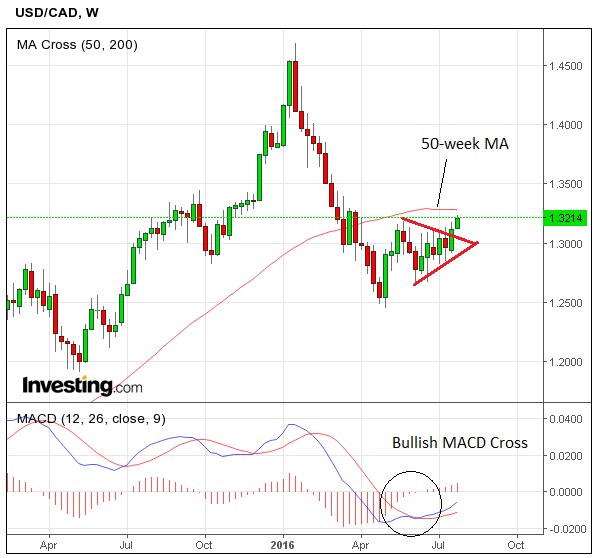
There is, however, one other major level which is in the way of the breakout extending higher, and that it the 50-week moving average at 1.3288, which would also be expected to lead to a stall in the pair if it reached it, and even a possible pull-back.
This is our favoured initial target, with the 1.3440 as a longer-term objective.
This is clearly illustrated on the weekly chart below:
Oil Prices: Barclays Stick With Recovery Thesis
For the Canadian Dollar, the trajectory of oil prices remains a central feature to the outlook.
Whether the recent slump in oil prices is the start of another period of stagnation, or whether it is a mere pullback in a broader recovery, will likely determine the extent of the damage done to USD/CAD.
The problem for oil producers is that global oil demand in Q3 16 is growing at less than one-third the rate it was in Q3 15, weighed down by anaemic economic growth.
Demand support from the OECD has faded, while growth from China and India has slowed, weighing on
balances in Q3.
However, analysts at Barclays believe that the blip will prove temporary.
"Beyond the weak point in Q3, however, India’s oil demand growth is set to accelerate over Q4 again, while China’s is set to moderate. The supply side is adjusting sharply in the backdrop, and an uptick in demand over Q4 is likely to tighten market balances again," says a note from the London-based bank.
Barclays see Brent prices recovering from $45/bbl in Q3 to $50/bbl in Q4 16.
In the medium term (2016-21), Barclays say they are affirming their upward-bound thesis.


