- Dollar Index to rise after recent breakout.
- Longer-term charts looking especially bullish for USD.
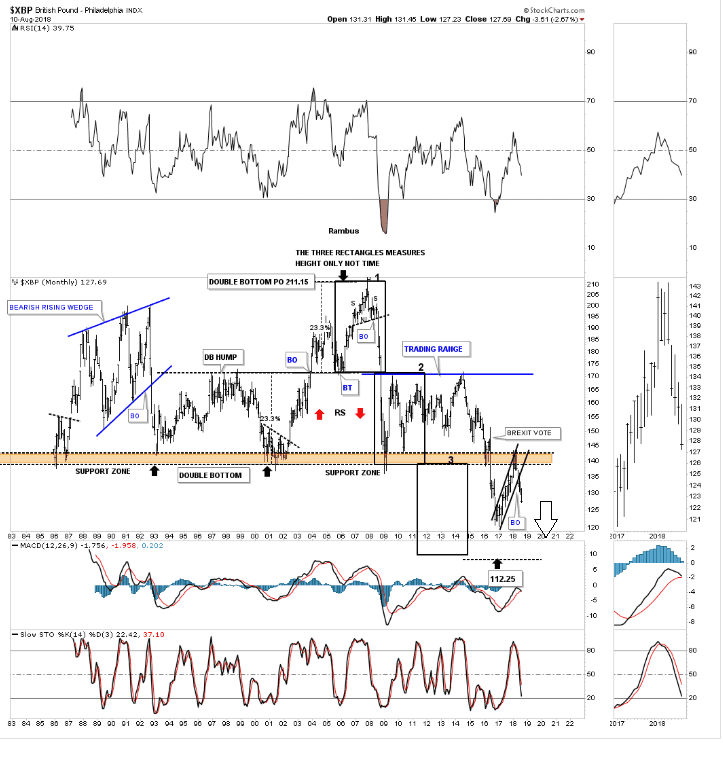
- GBP/USD may be poised for torrid retreat if 1.40 is neckline of huge H&S.

Image © Adobe Images
Price charts are showing the Dollar has developed an 'impulse move' which is likely to extend over the long-term, according to David Tablish, founder of Rambus Chartology.
The Dollar Index (DXY), which is calculated by taking the trade-weighted average of Dollar pairs, has just broken above a key consolidation zone and, according to Tablish, is looking extremely bullish (circled in red):
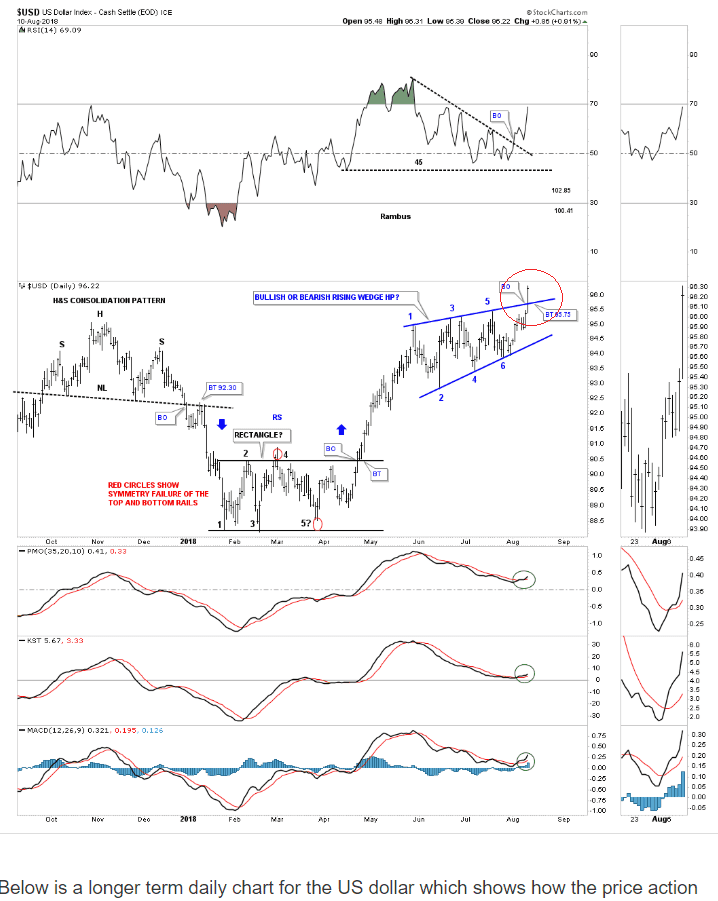
The momentum indicators PMO, KST and MACD in the lower panes are all turning sharply higher from trough-lows suggesting support for a new phase of bullish activity.
In the short-term, the index is expected to rise to a target at between 100-103, based on the height of the wedge pattern extrapolated from the breakout point.
A longer-term chart further suggests higher-highs are not unrealistic from an historical perspective.
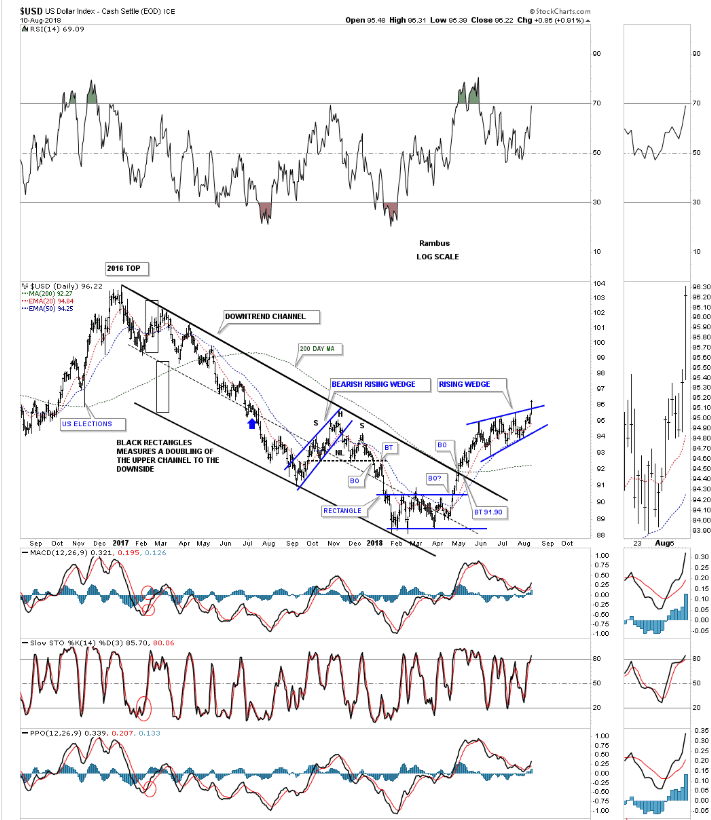
The sideways consolidation at the early 2018 lows provides a compelling case that a major bottom may be in place.
Panning out to even longer-term charts of DXY and the picture looks even more bullish.
The chart of the index from the 1970s shows how the Index has been falling in a bullish wedge pattern for many years from which it has only just broken out to the upside.
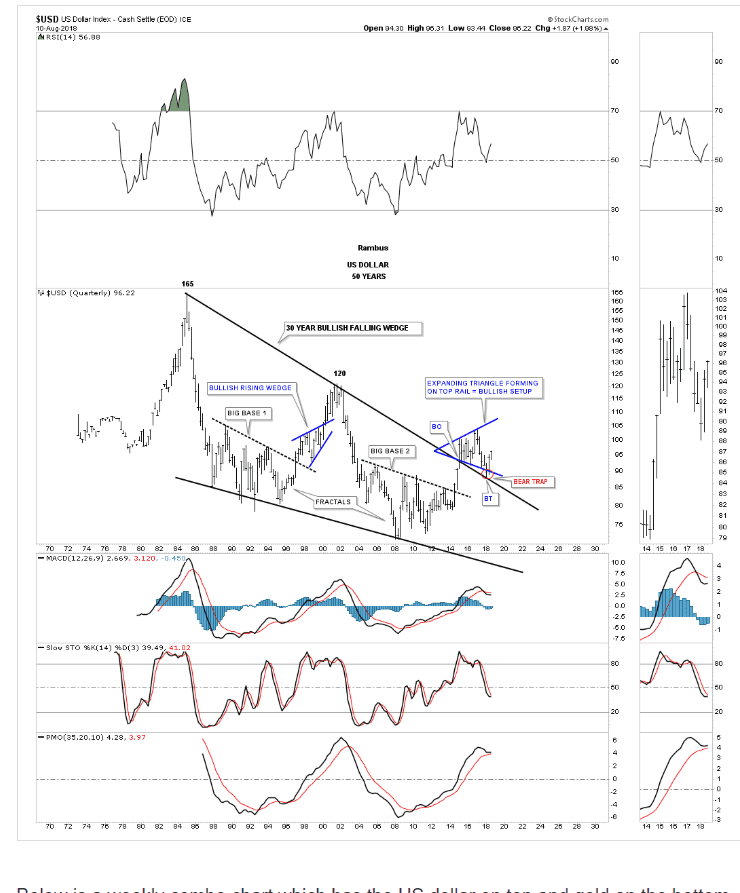
The breakout from the wedge is a momentous bullish technical event and generates a theoretical upside target of 165 for DXY - eventually!
"Will we ever see the 165 area again on the US dollar in our lifetime which would be the price objective of the 30 year falling wedge?" says Tablish.
At the same time as the Dollar is forecast to rise US Treasury Bond yields are expected to fall. Normally the two move in tandem as yields are a measure of the compensation bondholders get from inflation erosion and higher inflation usually means higher US interest rates which are a magnate to foreign capital and increase demand for the Dollar.
In this case, however, the Dollar's rise will not coincide with a similar rise in yields, according to Tablish, who also notes a clear H&S topping pattern appearing to form on chart of the US 10-year Treasury bond yield.
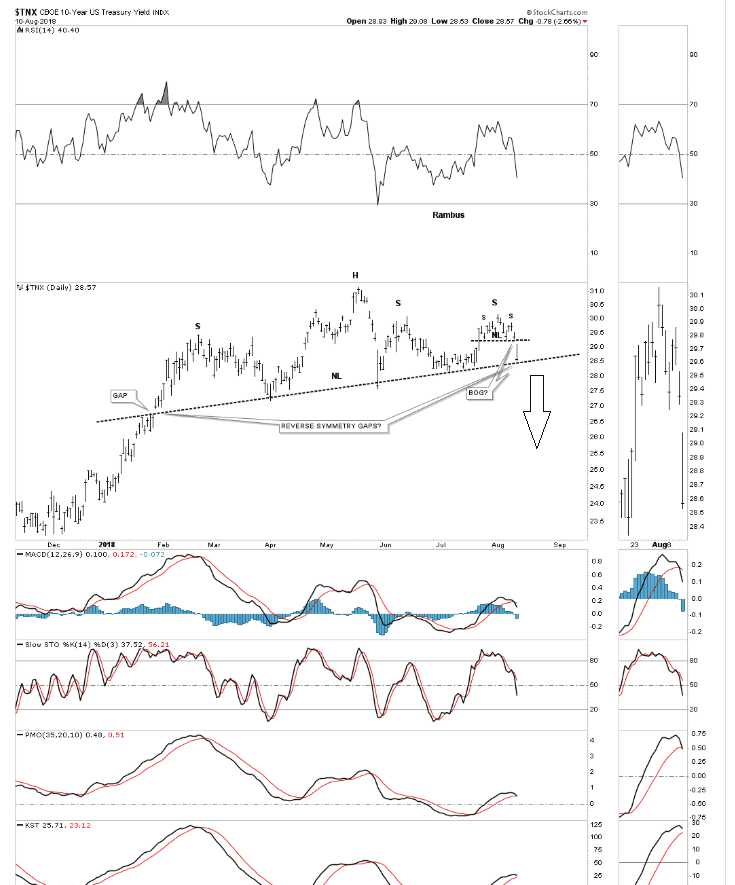
Should the 10-year yield break below the neckline at at about 2.85% it is likely to fall to the mid 2.0s.
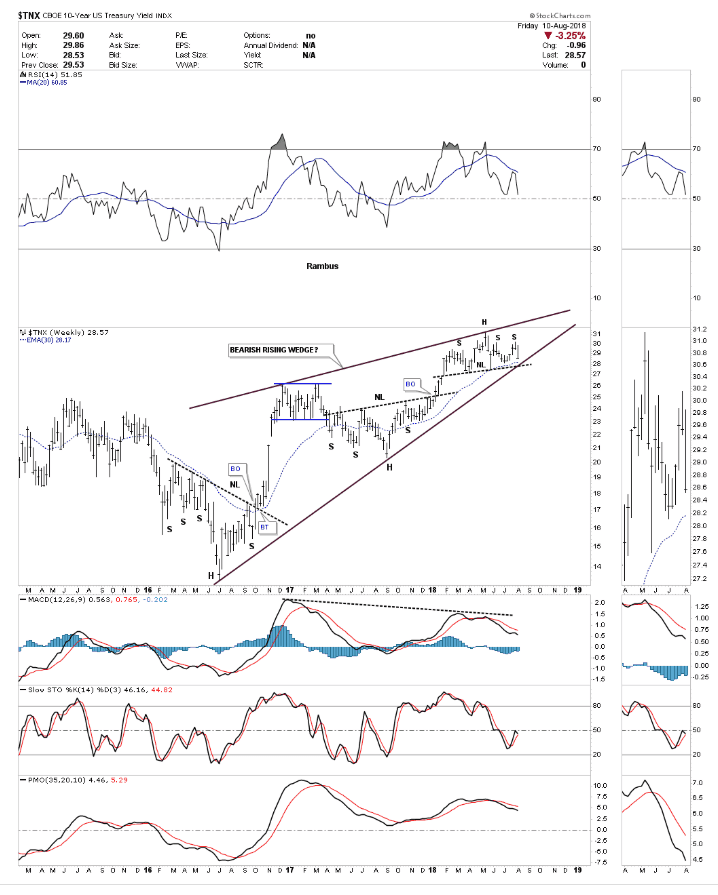
A longer-term chart of yields makes the argument for an even deeper decline, however, as it shows the pair may have formed a rising bearish wedge over the last 2-3 years, from which it is threatening to break out of.
The combination of rising Dollar and falling yields is a rare occurrence but happened once before in recent history in 2014-15 during the Dollar's rally when commodity prices and non-Dollar currencies went through similar declines.
"I’ve been speculating for the last couple of months that instead of seeing a strong inflationary environment over the intermediate term the charts are suggesting we could see a deflationary event sooner rather than later. At this point in time I would view it more like 2014 to 2015 time frame when the US dollar had its major impulse move up while currencies and commodities had large declines," says Tablish.
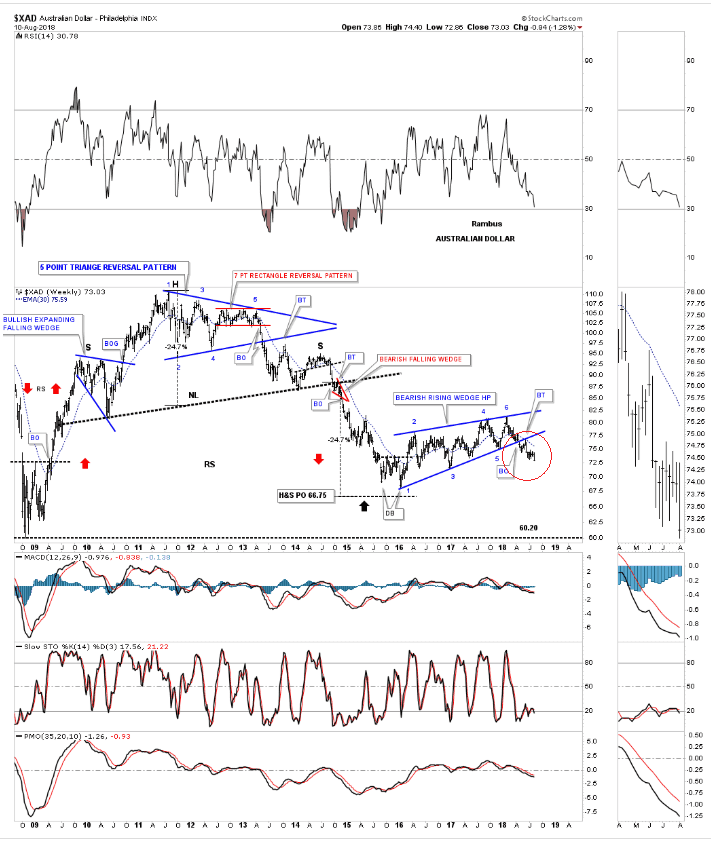
The combination of falling yield and rising Dollar does not augur particularly well for commodity prices - which are a major driver of global inflation - and also, therefore, commodity currencies such as the CAD, AUD and NZD.
All bar one of the Dollar's most heavily traded pairs, EUR/USD, GBP/USD, AUD/USD, CAD/USD and CHF/USD are in bearish downtrends at the moment, but it is the commodity couplings AUD/USD and CAD/USD in particular which are showing negative reads, according to Tablish.
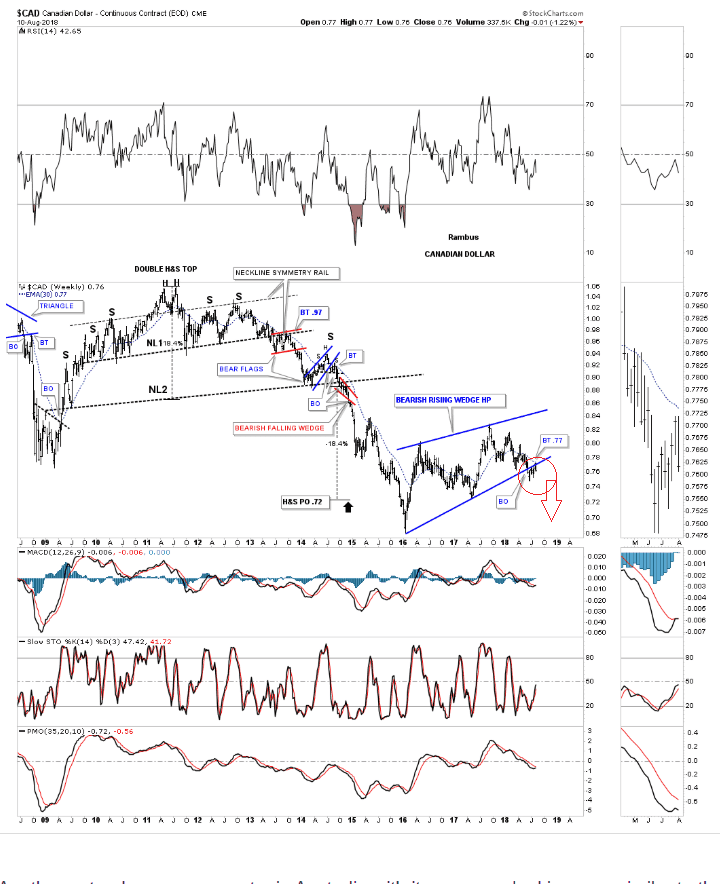
CAD/USD is breaking out of a rising wedge pattern which suggests deeper declines on the horizon for this pair.
The Aussie has broken down out of a similar wedge/consolidation pattern.
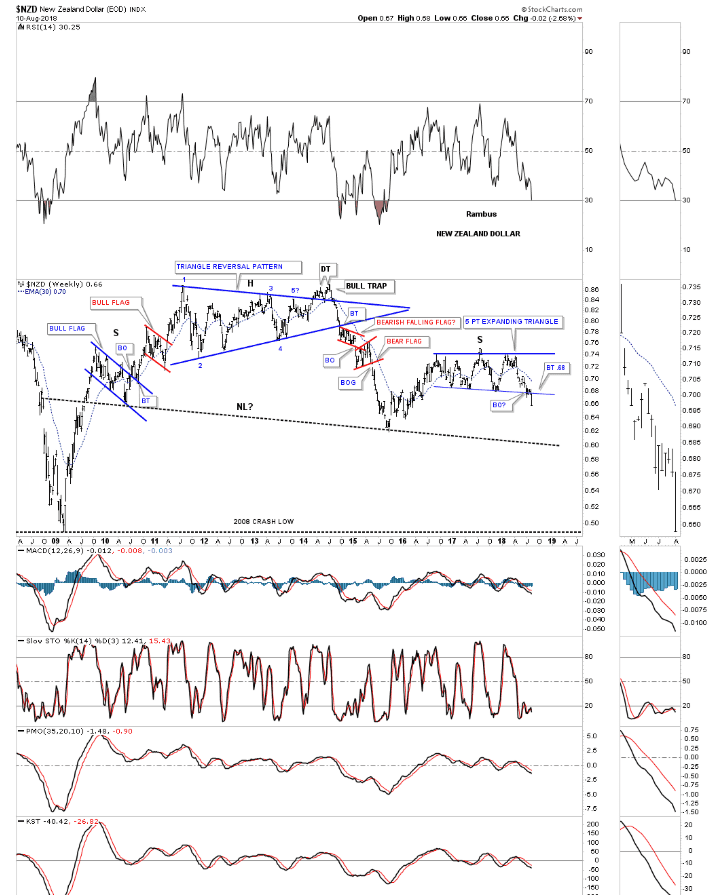
 The New Zealand Dollar-to-US Dollar rate has broken down below the lower border of an expanding triangle pattern, which is also a very bearish sign.
GBP/USD has been falling since April after a brief recovery. The longer-term charts, however, indicate this could be the start of a major down-move after the exchange rate broken below a sort of 'neckline' of a multi decade H&S pattern at 1.40.
Advertisement
Get up to 5% more foreign exchange for international payments by using a specialist provider to get closer to the real market rate and avoid the gaping spreads charged by your bank when providing currency. Learn more here